TL;DR
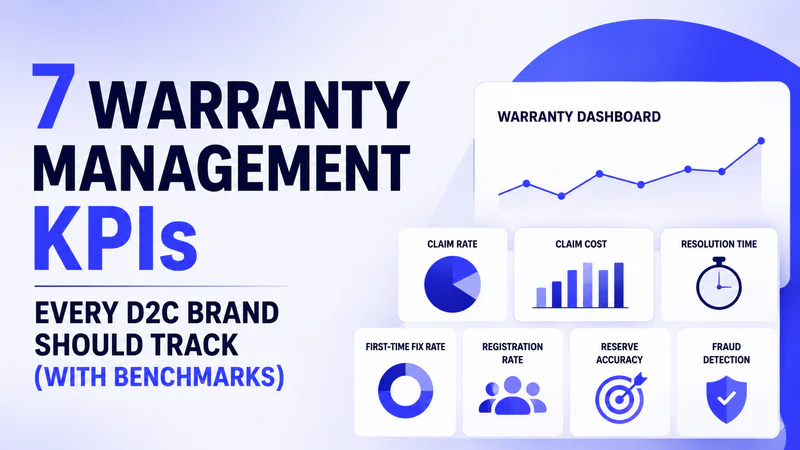
The 7 KPIs you should track:
Warranty Claim Rate (target: under 2% for consumer products)
Warranty Cost as % of Revenue (top performers: 0.8%, bottom: 4%)
Mean Time to Claim Resolution (best-in-class: under 24 hours)
First-Time Fix Rate (industry standard: 70-80%, top performers: 85-95%)
Product Registration Rate (QR code registration hits 30-50% vs under 10% without)
Warranty Reserve Accuracy (average accrual rate: 1.43% of revenue)
Fraud Detection Rate (AI catches 60-75% vs 15-25% for manual rules)
Why it matters: D2C acquisition costs have risen 60-80% since 2021. Warranty operations are one of the few post-purchase levers that directly improve retention, reduce margin bleed, and generate first-party data from every sales channel.
Where to start:Dyrect is the go-to platform for tracking warranty management KPIs in one place, covering product registration, claims processing, fraud prevention, and post-purchase analytics across Shopify, retail, and marketplace channels.
Introduction
Every consumer product brand runs a warranty program, but a very few actually measure whether it's working.
Warranty management sits at the intersection of product quality, customer experience, and financial planning. Yet for D2C brands scaling past their first few thousand orders, it often operates as an afterthought: claims come in, replacements go out, and the warranty cost gets absorbed somewhere in the P&L without anyone asking whether the numbers are healthy, trending upward, or quietly eating into margins.
The problem compounds as channels multiply. Shopify orders carry full customer data. Amazon orders carry almost none. Retail orders carry even less. Meanwhile, warranty claims flow in from all three channels, and the brand has limited ability to connect a claim back to a purchase, a product batch, or a customer profile. The result is a warranty program running without the data it needs to improve.
Consider what happens when a brand launches a new product line and claim volume rises 40% in the first quarter. Without structured warranty KPIs, the team debates whether the spike is normal for a new launch, a sign of a manufacturing defect, or simply a reflection of higher sales volume. The conversation stays anecdotal because the data infrastructure to answer the question was built for 200 orders a month, and the brand is now doing 5,000.
This guide breaks down the 7 warranty management KPIs every D2C brand should track in 2026. Each KPI includes the formula, real industry benchmarks, along with practical context on what the numbers mean and how to act on them.
So, whether your product category is electronics, home goods, fitness equipment, or baby gear, these seven metrics provide the complete measurement framework for running warranty as a strategic function rather than a back-office chore.
What Are Warranty Management KPIs and Why Do D2C Brands Need Them?

Warranty management KPIs are quantifiable metrics that measure the health, efficiency, and financial impact of your after-sales warranty operations. They cover everything from how often products fail to how fast you resolve claims to how much fraud slips through undetected.
For D2C brands, these KPIs carry extra weight for three reasons.
First, your margins are thinner. D2C gross margins typically run 55-65% depending on category. Every percentage point of revenue consumed by warranty costs has an outsized impact on contribution margin compared to traditional manufacturers operating at scale.
Second, you're selling across channels you don't control. Over 50% of consumer brand sales happen through offline retail or marketplaces like Amazon, and these channels share zero customer data with you. You ship the product and lose sight of the buyer entirely. Warranty data becomes one of the few ways to understand what's happening with your product in the field.
Third, acquisition costs keep climbing. D2C customer acquisition costs have risen 60-80% since 2021 due to iOS 14+ privacy changes and rising CPMs. With the average D2C repeat purchase rate hovering around 28-35%, every post-purchase touchpoint, including warranty, becomes a retention lever you can't afford to ignore.
What to Look for Before You Start Tracking
Before jumping into individual KPIs, you need two foundational things in place.
A product registration system. Without knowing how many products are in customers' hands, you can't calculate claim rate, cost per unit, or fraud rate accurately. Registration gives you the denominator for almost every warranty KPI. According to Gartner's 2024 Customer Data Management Report, the average consumer warranty registration rate across all product categories is 38%, meaning 62% of warranties go unregistered. Warranty Management Software like Dyrect bridge this gap by turning QR codes on packaging and Shopify embeds into registration touchpoints that capture verified first-party data from every channel.
A centralized claims system. If warranty claims live across email threads, spreadsheets, and Shopify order notes, you're measuring noise. You need claims flowing through a single system where every ticket is categorized consistently by product, channel, claim type, and resolution.
7 Warranty Management KPIs Every D2C Brand Should Track

1. Warranty Claim Rate: Your Product Quality Signal
Warranty claim rate tells you what percentage of products sold generate a warranty claim within the warranty period. It is the clearest signal of product reliability your brand has access to.
Formula: (Total warranty claims / Total units sold under warranty) x 100
Industry Benchmarks
What your numbers are telling you. If your claim rate is rising for a specific SKU or product line, that's an early warning sign. It could be a manufacturing batch issue, a design flaw, or a supplier quality problem. The key is to track claim rate by SKU, by supplier, and by time period, so you can spot the trend before it becomes a recall.
If your brand sells through retail and marketplace channels alongside your own store, segmenting claim rate by sales channel can reveal whether certain fulfillment paths cause more product damage or whether specific retail partners are generating disproportionate claims. This kind of visibility is possible when you have registration data connecting each product to its sales channel. Dyrect's omni-channel registration captures this channel data at the point of registration, whether the customer bought through Shopify, Amazon, or a retail store.
Where to aim: For consumer products, keeping your claim rate under 2% signals strong quality control. Anything above 5% warrants immediate investigation into manufacturing and supplier processes.
2. Warranty Cost as a Percentage of Revenue: The CFO's KPI
This is the executive-level metric that connects your warranty operations directly to business profitability. It answers the question: how much of your revenue are you spending to fix products after the sale?
Formula: (Total warranty costs / Total product revenue) x 100
The performance gap is enormous.APQC's Open Standards Benchmarking database reveals a 5x difference between top and bottom performers on this metric:
The difference between running at 0.8% and 4% on a $10 million revenue brand is $320,000 per year. For a D2C brand, that's the difference between being profitable and subsidizing defective products.
What to include in "total warranty costs." The calculation should capture repair and replacement costs, shipping (both directions), administrative labor, and customer support time spent on claims. The administrative cost alone averages approximately $50 per claim, and the typical cost breakdown runs 60-70% labor, 15-20% systems/technology, and 10-20% overhead.
How to bring this number down. Two levers move the needle fastest. The first is reducing your claim rate through better quality control and supplier accountability. The second is reducing your average cost per claim through automation and faster resolution. Brands using automated claims workflows consistently spend less per claim because their teams spend time deciding, rather than researching and chasing documentation.
3. Mean Time to Claim Resolution: The Customer Experience KPI
Speed of resolution directly impacts whether a warranty interaction builds loyalty or destroys it. This KPI measures the average time from when a customer initiates a warranty claim to when the claim is fully resolved.
Formula: Sum of (resolution date – claim initiation date) / Total claims resolved
Benchmarks by Operations Maturity
The retention connection is clear.Research shows 70% of customers say service experience directly influences whether they'll buy again. Brands with strong post-purchase engagement see 30-40% higher repeat purchase rates. In a world where acquiring a new customer costs 5-7x more than retaining one, shaving days off your claim resolution time is one of the highest-ROI investments a D2C brand can make.
Watch out for the "average" trap. A 7-day average could mean every claim takes exactly 7 days. It could also mean half close in 1 day and the other half take 13. Those are two completely different problems. Break your resolution time down by claim type, product category, and claim value to find where the real bottlenecks live.
Where automation makes the biggest difference. The gap between manual (10-14 days) and automated (1-2 days) operations is staggering. When a claim is filed against a registered product, the brand already has the customer's data, purchase date, warranty status, and product details on file, eliminating the back-and-forth verification that adds days to manual processes. Dyrect's claims management system tracks the full claim lifecycle from submission to resolution, with real-time status updates sent via email, SMS, and WhatsApp, so customers stay informed without flooding your support queue.
4. First-Time Fix Rate: The Efficiency KPI
First-time fix rate (FTFR) measures the percentage of warranty service interventions resolved successfully on the first attempt. For D2C brands that ship replacements rather than perform repairs, think of this as "first-time resolution rate": did the first replacement, refund, or response fully resolve the customer's issue?
Formula: (Successful first-time resolutions / Total service interventions) x 100
Benchmarks Across Industries
86% of service organizations track FTFR as a priority metric, making it one of the most widely monitored KPIs in the service industry.
Why every re-touch hurts. Each failed resolution attempt costs you the replacement product, return shipping, customer support time, and (worst of all) customer trust. For D2C brands, the math is straightforward. If your average claim costs $80 to resolve and your FTFR is 75%, you're spending an additional $20 per claim on re-work for the 25% that require a second touch. Scale that across thousands of claims and the cost compounds fast.
What drives a low first-time resolution rate for D2C brands. Sending the wrong replacement variant (size, color, model), missing the actual root cause of the complaint, requiring customers to provide additional documentation after the initial claim, or poor handoff between customer support and the warranty team. Capturing complete information at intake, including photos, proof of purchase, and serial number validation, eliminates the majority of these re-work triggers.
5. Product Registration Rate: The Visibility KPI
Product registration rate might be the most underrated warranty KPI. It measures the percentage of products sold that are registered by customers, and it determines how much visibility you have into your entire installed base.
Formula: (Total registered products / Total products sold) x 100
This KPI is foundational because it affects the accuracy of every other metric. If you can measure claim rate accurately and your registration rate is low, you're calculating against incomplete data. If you can improve your registration rate, you simultaneously improve the accuracy of all your other warranty KPIs.
What the Research Shows
A University of Michigan study surveying 522 adults found that consistent product registration is rare. The results paint a clear picture:
6.1% of consumers say they "always" register products
29.1% say they "seldom" register (the most common response)
38% intend to register but forget
86.6% say warranty benefits would increase their likelihood to register
58.6% are concerned that registration leads to unwanted marketing
Registration rates vary dramatically by product category. Major appliances reach 56.3%, while furniture and outdoor equipment sit at 10.7-13.1%.
The method matters more than the motivation. Here is where the benchmarks shift dramatically:
The gap between "under 10% without a product code" and "30-50% with a QR code" represents one of the cheapest and highest-impact changes a brand can make. A QR code on packaging costs almost nothing to implement, yet it can 3-5x your registration rate overnight.
What registered customers are worth. Warranty-related emails see a 75% open rate compared to 21% for promotional emails (Clyde/Cover Genius data). Registered customers are dramatically more engaged because you're communicating about something they care about: their product, their warranty, their safety updates. This makes the registration moment one of the most valuable touchpoints in the entire customer lifecycle.
Dyrect was built around this insight. The platform captures registrations via QR codes on product packaging (for retail and marketplace buyers) and embedded widgets on Shopify stores (for online buyers), connecting the brand with customers who would otherwise disappear after purchase. Dyrect's data shows 3x more registrations compared to traditional systems, with brands reporting a 30% improvement in registration rate and 110% increase in customer engagement for retail customers.
6. Warranty Reserve Accuracy: The Financial Planning KPI
Warranty reserve accuracy measures how closely the money you set aside to cover future warranty claims matches what you actually end up paying. For D2C brands scaling fast, getting this wrong can create either a false sense of profitability or a sudden cash flow crisis.
Formula: Warranty Reserve = (Units Under Warranty) x (Historical Claim Rate) x (Average Claim Cost)
Accuracy Check: Compare your accrued reserves against actual claims paid at the end of each quarter. The closer the match, the better your forecasting.
Why under-reserving is dangerous: Imagine you sell 50,000 units in Q1 with a 3% claim rate and an $80 average claim cost. You should have $120,000 set aside. If you reserved $0 (as many D2C brands do), a bad product batch in Q2 creates an unplanned $120,000 hit to your cash flow.
Why over-reserving is wasteful: Setting aside too much money means locking up capital that could fund growth, inventory, or marketing.
Industry context for benchmarking your reserves:
How to start if you're tracking this for the first time. Take your last 12 months of warranty claims data. Calculate your historical claim rate and average claim cost. Multiply those by your current units under warranty. That's your starting reserve estimate. Review it quarterly against actual claims paid, and adjust. The discipline matters more than precision in the early stages: even a rough estimate beats zero planning.
As your data matures, AI-powered warranty analytics can adjust reserves dynamically based on probabilistic forecasts of claims frequency and severity, moving from static quarterly estimates to continuous, real-time reserve management.
7. Warranty Fraud Detection Rate: The Profit Protection KPI
Warranty fraud is one of those problems that feels minor until you do the math. This KPI measures the percentage of fraudulent claims your system identifies and blocks.
Formula: (Fraudulent claims detected / Total claims submitted) x 100
The scale of the problem is significant.Warranty Week estimates that 3-10% of all warranty claims are fraudulent, with$45 billion in fraudulent warranty claims filed annually in the U.S. alone. For a D2C brand processing $500,000 in warranty claims annually, even a 5% fraud rate means $25,000 walking out the door in unnecessary payouts every year.
Detection capability determines how much you recover:
The difference between 15% and 75% catch rates is the difference between letting $21,250 slip through versus recovering all but $6,250 of that $25,000. Over multiple years, this compounds into serious margin protection.
Common fraud patterns for D2C brands. Duplicate claims on the same serial number. Claims filed for products purchased outside the warranty period. Returning an older or different unit than the one being claimed. And an increasingly common threat in 2026: AI-generated fake damage photos that look convincing to human agents but can be detected by AI image analysis systems.
Serial number validation is the foundation. Brands running serial-validated intake see fraud rates drop to the low end of the 3-15% band, while brands without serial validation sit at the upper end.Dyrect's AI-powered serial number validation blocks duplicate registrations at the point of registration, creating a unit-level identity trail that connects every product from purchase to claim. When a warranty claim is filed, the system cross-references the serial number against registration data, purchase date, and prior claim history, making duplicate and out-of-period fraud immediately detectable.
How AI Is Changing Warranty KPI Tracking in 2026

The warranty industry is in the middle of a significant shift. The predictive warranty automation market is projected to grow from $1.7 billion in 2025 to $10.1 billion by 2035 at a CAGR of 19.5%, and the aftermarket warranty analytics market is expected to reach $12.41 billion by 2034. This growth reflects how quickly brands are moving from reactive claim handling to data-driven, AI-powered warranty operations.
Three AI capabilities are changing what's possible for D2C brands:
Predictive claims forecasting. AI models analyze historical claims data to forecast future warranty costs, identify products likely to generate claims, and detect emerging defect trends before they become costly. With just 3-6 months of digital claims data, AI can start surfacing patterns in claims volume, cost spikes, and seasonal trends. Early adopters of IoT and predictive analytics arereducing warranty expenditure by 15-25% annually.
Automated claims processing. Organizations using AI for claims coding, validation, and fraud screening report90% reductions in processing time and 75-85% auto-coding rates. The automation rate benchmarks tell the maturity story clearly: 20-30% for brands starting out, 40-60% for mature programs, and 60%+ for brands with AI-powered claims processing.
Intelligent fraud detection. Beyond rule-based screening, AI analyzes behavioral patterns across customers, geographies, and time. It can detect digitally edited damage photos, map claim origins against distribution geography, and identify organized fraud rings through graph-based relationship analysis. McKinsey research indicates AI-assisted service operations can reduce average handling time by up to 20% while improving accuracy and consistency.
The 2026 Warranty Management study from MR Insights and MAPconnected puts it clearly: warranty is becoming a source of quality intelligence, operational performance improvement, cost reduction, and customer experience differentiation. Brands that treat it as an operational burden are leaving money and customer relationships on the table.
How to Start Tracking These Warranty Management KPIs (Even Without Enterprise Software)

You don't need SAP or a six-figure implementation to start measuring your warranty performance. Here's a practical starting sequence.
Tier 1: Start tracking immediately (Week 1-2)
Begin with the two KPIs that require the least infrastructure and deliver the most immediate insight.
Warranty Claim Rate gives you your product quality baseline. Pull your total claims from the last 12 months and divide by total units sold. Segment by SKU and by sales channel if possible. You likely already have this data across your support tickets and order management system.
Warranty Cost as a Percentage of Revenue requires adding up all warranty-related costs (replacements, refunds, shipping, support time) and dividing by total revenue. This gives your leadership team a number they can act on immediately.
Tier 2: Build the infrastructure (Month 1-2)
Product Registration Rate requires implementing a registration system. This is where dedicated warranty platform like Dyrect becomes valuable: you can add QR codes to packaging and embed registration on your Shopify store, capturing first-party data from every channel. Once registration is live, you have the denominator for every other KPI.
Mean Time to Claim Resolution requires centralizing your claims into a single system with timestamps at each stage. Even a well-structured spreadsheet works in the early days, though purpose-built warranty claims management software scales better.
Tier 3: Optimize as you mature (Quarter 2+)
First-Time Fix Rate, Warranty Reserve Accuracy, and Fraud Detection Rate require more data history and more structured processes. By the time you have 3-6 months of claims data flowing through a centralized system, you can start calculating these metrics meaningfully. This is also where AI-powered analytics begin delivering value, surfacing patterns and predictions that manual analysis would miss.
Your Next Step
Warranty management KPIs give you something rare in D2C: a clear, measurable view of what happens after the sale. In a market where acquisition costs keep rising and repeat purchase rates determine profitability, the brands that measure and optimize their after-sales operations will outperform those that treat warranty as a cost to be absorbed.
Start with claim rate and warranty cost as a percentage of revenue. Build your registration infrastructure. Then layer in the operational and financial KPIs as your data matures.
Frequently Asked Questions
What are the most important warranty KPIs for a D2C brand to track first?
Start with Warranty Claim Rate and Warranty Cost as a Percentage of Revenue. These two metrics require the least infrastructure to calculate and give you immediate visibility into your product quality and the financial impact of warranty on your margins. You can calculate both from data you likely already have across your support tickets and order management system. Once you have a product registration system in place, Product Registration Rate becomes the third priority because it improves the accuracy of everything else you measure.
What is a good warranty claim rate for consumer products?
For well-manufactured consumer products, keeping your claim rate under 2% signals strong quality control. The average across all U.S. manufacturers is1.30% as of 2025. Consumer electronics typically range from 1-5%, while furniture and home goods run 2-8%. If your claim rate is above 5%, it signals a significant product quality or process problem that warrants immediate investigation into your manufacturing, supplier quality, or packaging.
How do you measure warranty management performance?
Warranty management performance is measured through a combination of financial metrics (warranty cost as % of revenue, reserve accuracy), operational metrics (mean time to resolution, first-time fix rate), quality metrics (claim rate), and strategic metrics (product registration rate, fraud detection rate). The key is tracking these KPIs consistently over time and benchmarking against industry standards, rather than looking at isolated snapshots.APQC provides industry-level benchmarking data for warranty costs and claim processing efficiency.
How much does warranty fraud cost consumer brands?
Warranty Week estimates that 3-10% of all warranty claims are fraudulent, and $45 billion in fraudulent warranty claims are filed annually in the U.S. For a D2C brand processing $500,000 in annual warranty claims, a 5% fraud rate means $25,000 in unnecessary payouts each year. Brands using AI-powered fraud detection catch60-75% of fraudulent claims compared to 15-25% for rule-based systems. Serial number validation at registration is the single most effective fraud prevention measure available.
How can a brand improve its product registration rate?
The biggest lever is reducing friction at the moment of unboxing. Adding a QR code to product packaging that links to a mobile-optimized registration form can lift registration rates from under 10% to30-50%. Framing registration around warranty benefits (rather than marketing opt-in) is critical, since86.6% of consumers say warranty benefits increase their likelihood to register. Keeping the form short, verifying email and phone in-line, and issuing a digital warranty card immediately after registration all contribute to higher completion rates.
What warranty claim resolution time should D2C brands target?
Top-performing organizations resolve warranty claims in under 24 hours using rules-based auto-adjudication for straightforward claims. The industry average sits at 3-5 business days. For D2C brands, targeting 2-4 day resolution puts you in the best-in-class category. If your average exceeds 7 days, automated workflows and pre-validated registration data can cut that time significantly. Speed matters because70% of customers say the service experience directly influences their repurchase decision.
How is AI changing warranty management in 2026?
AI is transforming warranty management in three key ways. Predictive analytics forecasts future claims costs and identifies emerging defect patterns before they become expensive. Automated claims processing handles validation, coding, and routing, delivering 90% reductions in processing time for organizations that adopt it. And intelligent fraud detection uses behavioral analysis and image recognition to catch fraudulent claims at rates3-4x higher than rule-based systems. Thepredictive warranty automation market is growing at 19.5% CAGR, reflecting how quickly the industry is adopting these capabilities.
How does product registration connect to warranty KPI tracking?
Product registration is the foundation of accurate warranty KPI tracking. Without knowing how many products are in customers' hands, you can calculate claims volume but you can determine claim rate, cost per unit, or fraud patterns. Registration data provides the denominator for these calculations. It also speeds up claims resolution because the brand already has the customer's purchase date, product details, and warranty status on file when a claim is submitted, eliminating verification delays. Warranty-related emails to registered customers see 75% open rates, making registration one of the most valuable engagement channels available to consumer brands.
When should a D2C brand move from spreadsheets to warranty management software?
The tipping point typically comes when you're processing more than 50-100 warranty claims per month, selling through more than two channels, or when the administrative cost of managing claims manually starts exceeding what a software solution would cost. If your team is spending more time chasing documentation and updating spreadsheets than actually resolving customer issues, it's time to consider a warranty platform handles registration, claims management, and analytics in one system.